Configuring KPI Layouts
The KPI Layouts table lets you configure up to 20 graph layout pages for the device's performance monitoring parameters (key performance indicators or KPI). Each KPI Layout defines the number and positioning of the graphs on the page. The graphs contain the selected performance monitoring parameters (configured later in Adding Performance Monitoring Graphs to KPI Layouts).
You can configure a KPI Layout with one of the following layout designs:
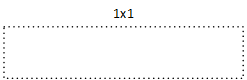
| ■ | 1x1 (one graph): |
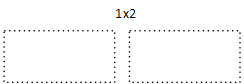
| ■ | 1x2 (two graphs, positioned side by side): |
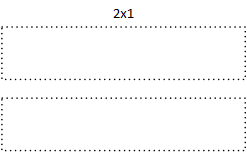
| ■ | 2x1 (two graphs, positioned one below the other): |
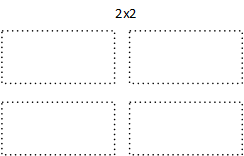
| ■ | 2x2 (four graph panels, two positioned side by side on one row and another two below, also positioned side by side): |
Once you have configured a KPI Layout, you can configure a graph to plot performance monitoring parameters, as described in Adding Performance Monitoring Graphs to KPI Layouts.
The following procedure describes how to configure KPI layouts through the Web interface. You can also configure it through ini file [KPIGraphs] or CLI (configure system > kpi > layouts).
| ➢ | To configure a KPI layout: |
| 1. | Open the KPI Layouts table (Monitor menu > Monitor tab > Performance Monitoring folder > KPI Layouts). |
| 2. | Click New; the following dialog box appears: |
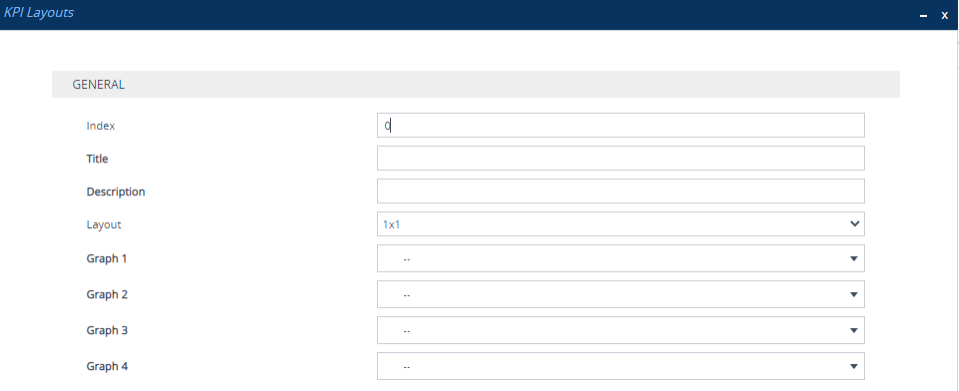
| 3. | Configure a KPI Layout according to the parameters described in the table below. |
| 4. | Click Apply. |
KPI Layouts Table Parameter Descriptions
|
Parameter |
Description |
||||||||||||
|---|---|---|---|---|---|---|---|---|---|---|---|---|---|
|
'Index' [Index] |
Defines an index number for the new table row. Note: Each row must be configured with a unique index. |
||||||||||||
|
'Title' layouts-title [Title] |
Defines a name for the layout. Once you have configured the layout, it is listed with this name in the Navigation pane under the Performance Monitoring folder > Layouts subfolder. The valid value is a string of up to 39 characters. Note: Configure each row with a unique name. |
||||||||||||
|
'Description' layouts-description [Description] |
Defines an arbitrary name to easily identify the layout. |
||||||||||||
|
'Layout' layouts-layout [Layout] |
Defines the layout, regarding number and positioning of graphs (see also the illustrations in the beginning of this section).
|
||||||||||||
|
'Graph 1-4' layouts-graph1-4 [Graph1], [Graph2], [Graph3], [Graph4] |
Selects the graphs (configured in Adding Performance Monitoring Graphs to KPI Layouts) to add to the layout. This field is used after you have configured your graphs, especially when you want to select graphs that were originally added to other KPI layouts. Note:
|